Lecture Materials
Percolation threshold#
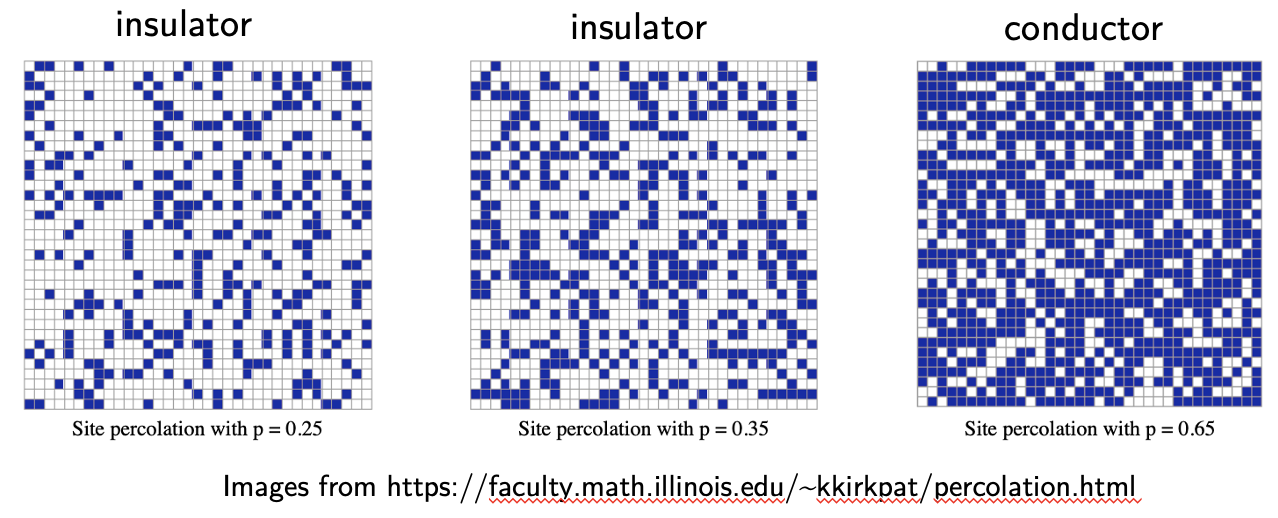
Percolation theory studies the formation of long-range connectivity in random systems. Discrete percolation can be considered on a lattice, where each site can be either free or occupied, and connected to neighboring sites. In continuum percolation one fills available space with overlapping object that can overlap and bond into clusters.
Above a certain occupation threshold – called percolation threshold \(0 < p_c < 1\) there exists a giant connected component of order of system size, while below it it does not. In practice the connected component may correspond to fluid flow through a porous medium, or an electrically conductive admixture.
Near \(p = p_c\) the system can exhibit many interesting phenomena similar to critical phenomena near the critical point.
Square lattice percolation#
In square lattice percolation one has an \(N\)x\(N\) grid where each site is occupied with a probability \(p\) and the neighboring occupied sites can form a cluster.
We can estimate the percolation threshold \(p_c\) through Monte Carlo modeling. There are two strategies we can employ:
Consider different values of \(p\). For every given \(p\) label each site with probability \(p\) to be occupied. Then use cluster-finding algorithm and see if a percolating cluster (for instance one that runs all the way from top to bottom of the grid) is formed. For large enough \(N\) we expect that percolating cluster forms for \(p > p_c\) and does not form for \(p < p_c\).
Randomly pick unoccupied site and mark it as occupied. Check if a percolating cluster is found. If not, repeat the process by labeling a new unoccupied site as occupied until a percolating cluster is formed. We expect the percolating cluster to form when the ratio of occupied sites to the total number of sites is of order \(p_c\).
Let us implement the 2nd strategy. For efficient cluster finding we will use the union-find data structure.
# Class implementing the union-find structure with a 2D (x,y) index
# This will also store the minimum and maximum y (vertical) coordinate of each set
class UnionFind:
    def __init__(self, N):
        self.N = N
        self.parent = list(range(N**2))
        self.rank = [0] * N**2
        self.maxy = [0] * N**2
        self.miny = [0] * N**2
        for x in range(N):
            for y in range (N):
                ind = self.index(x,y)
                self.maxy[ind] = y
                self.miny[ind] = y

    def index(self, x, y):
        return self.N * x + y

    def findxy(self, x, y):
        return self.find(self.index(x,y))

    def find(self, ind):
        if self.parent[ind] != ind:
            self.parent[ind] = self.find(self.parent[ind])
        return self.parent[ind]

    def unionxy(self, x1, y1, x2, y2):
        self.union(self.index(x1,y1), self.index(x2,y2))

    def union(self, ind1, ind2):
        root_1 = self.find(ind1)
        root_2 = self.find(ind2)

        if root_1 == root_2:
            return

        if self.rank[root_1] > self.rank[root_2]:
            self.maxy[root_1] = max(self.maxy[root_1], self.maxy[root_2])
            self.miny[root_1] = min(self.miny[root_1], self.miny[root_2])
            self.parent[root_2] = root_1
        else:
            self.maxy[root_2] = max(self.maxy[root_1], self.maxy[root_2])
            self.miny[root_2] = min(self.miny[root_1], self.miny[root_2])
            self.parent[root_1] = root_2
            if self.rank[root_1] == self.rank[root_2]:
                self.rank[root_2] += 1
import numpy as np
import matplotlib.pyplot as plt
from matplotlib.colors import ListedColormap

plotSimulation = False
cellsToPlot = []
fractions = []

## Simulate percolation threshold on a square in 2D
## Return the fraction of occupied cells at percolation
def simulateSquarePercolation(N):
    cells = np.zeros([N,N])
    occupied = 0
    global cellsToPlot, fractions
    if (plotSimulation):
        cellsToPlot = []
        cellsToPlot.append(cells.copy())
        fractions = []
        fractions.append(occupied / N**2)

    uf = UnionFind(N)
    while True:
        # Choose unoccupied cell to occupy
        while True:
            ind = np.random.randint(N**2)
            x = ind // N
            y = ind % N
            if (cells[x][y] == 0):
                break
        cells[x][y] = 1
        occupied += 1

        # Add the new cell to existing clusters
        if (x > 0 and cells[x-1][y] == 1):
            uf.unionxy(x,y,x-1,y)
        if (x < N - 1 and cells[x+1][y] == 1):
            uf.unionxy(x,y,x+1,y)
        if (y > 0 and cells[x][y-1] == 1):
            uf.unionxy(x,y,x,y-1)
        if (y < N - 1 and cells[x][y+1] == 1):
            uf.unionxy(x,y,x,y+1)

        ymin = uf.miny[uf.find(ind)]
        ymax = uf.maxy[uf.find(ind)]

        if (plotSimulation and occupied%(8*N) == 0):
            cellsToPlot.append(cells.copy())
            fractions.append(occupied / N**2)

        # # plot the data points
        # if plotSimulation:
        #     toPlot = False
        #     # Percolating cluster found
        #     if (ymin == 0 and ymax == N-1):
        #         indperc = uf.find(ind)
        #         for x in range(N):
        #             for y in range(N):
        #                 if (uf.findxy(x,y) == indperc):
        #                     cells[x][y] = 2
        #         toPlot = True

        #     if (occupied%400 == 0):
        #         toPlot = True

        #     if (toPlot):
        #         clear_output(wait=True)
        #         # time.sleep(0.01)
        #         plt.title("Square percolation, ${p = }$" + '{0:.3f}'.format(occupied / N**2))
        #         plt.xlabel("x")
        #         plt.ylabel("y")
        #         cmap = ListedColormap(['w', 'black', 'red'])
        #         CS = plt.imshow(cells.T, vmax=2, vmin=0,origin="lower",extent=[0,N,0,N], cmap=cmap,  interpolation='nearest')
        #         # plt.colorbar(CS)
        #         plt.show()

        # Check if percolating cluster is found
        if (ymin == 0 and ymax == N-1):
            indperc = uf.find(ind)
            for x in range(N):
                for y in range(N):
                    if (uf.findxy(x,y) == indperc):
                        cells[x][y] = 2

            if (plotSimulation):
                cellsToPlot.append(cells.copy())
                fractions.append(occupied / N**2)
            return occupied / N**2
Perform a single simulation of square percolation for N = 400.
N = 400
print("p_c = ", simulateSquarePercolation(N))
p_c = 0.5914125
The obtained value of \(p_c\) is very close to the literature value of \(p_c \approx 0.5927..\).
To estimate the error of the obtained value of \(p_c\), we can perform the simulation multiple times and estimate the error of the average value.
# Simulate square NxN percolation M times
# Returns average and the error estimate for pc
def simulateSquarePercolationAverage(N, M):
    total = 0
    totalsq = 0
    for i in range(M):
        p = simulateSquarePercolation(N)
        total += p
        totalsq += p**2

    p_av = total / M
    p2_av = totalsq / M

    return p_av, np.sqrt((p2_av - p_av**2)/N)
%%time

N = 10
M = 10000
plotSimulation = False

pc, pc_err = simulateSquarePercolationAverage(N,M)
print("Simulating square percolation")
print("NxN = ",N,"x",N," with M =",M, "samples")
print("p_c = ", pc, "+-", pc_err)
Simulating square percolation
NxN =  10 x 10  with M = 10000 samples
p_c =  0.5913600000000038 +- 0.02296586684624111
CPU times: user 3.08 s, sys: 21.2 ms, total: 3.1 s
Wall time: 3.21 s